Comparison

Comparing Android's Growth to Other Mobile Operating Systems

Throughout the history of mobile operating systems, Android has not always been in the lead. Between 2009 and 2012, it was in a fierce competition with Apple's iOS, which held a significant market share due to the popularity of the iPhone. Other operating systems like BlackBerry OS and Windows Mobile also had their moments of prominence, but never quite reached the same levels of market share during the 2009-2025 period. By 2013, Android had overtaken iOS in global market share, a position it has maintained ever since. The ability to cater to a wide range of devices, from budget to premium, has been a key factor in Android's sustained dominance in the mobile OS market.

🖱️ Click on a year for a detailed breakdown of its data! Click Year Example
Mobile Operating System Market Share by Year (2009-2025)
Year Android
Android is an operating system developed by Google. This datapoint represents the market share of Android OS in the global mobile operating system market.
iOS
iOS is an operating system developed by Apple. This datapoint represents the market share of iOS in the global mobile operating system market.
BlackBerry OS
BlackBerry OS is an operating system developed by BlackBerry. This datapoint represents the market share of BlackBerry OS in the global mobile operating system market.
Samsung OS
Samsung OS is an operating system developed by Samsung. This datapoint represents the market share of Samsung OS in the global mobile operating system market.
Windows Mobile
Windows Mobile is an operating system developed by Microsoft. This datapoint represents the market share of Windows Mobile in the global mobile operating system market.
2009 2.19 34.9 7.44 0.78 1.9
2010 8.01 27.55 14.57 2.71 0.5
2011 18.8 22.13 11.84 5.27 0.54
2012 27.07 24.02 5.32 6.34 0.87
2013 39.01 24.35 3.53 4.67 1.51
2014 53.15 23.87 1.85 2.72 2.36
2015 64.02 20.18 1.17 1.09 2.3
2016 69.39 19.43 0.71 0.61 1.7
2017 72.8 19.6 0.27 0.34 0.83
2018 75 20.43 0.09 0.28 0.46
2019 75.53 22.87 0.03 0.22 0.22
2020 73.16 26.43 0.01 0.21 0.05
2021 71.86 27.22 0 0.39 0.02
2022 71.49 27.72 0 0.39 0.02
2023 70.61 28.58 0 0.36 0.02
2024 71.87 27.67 0 0.34 0.02
2025 72.67 26.87 0 0.24 0.01
Hovering Example
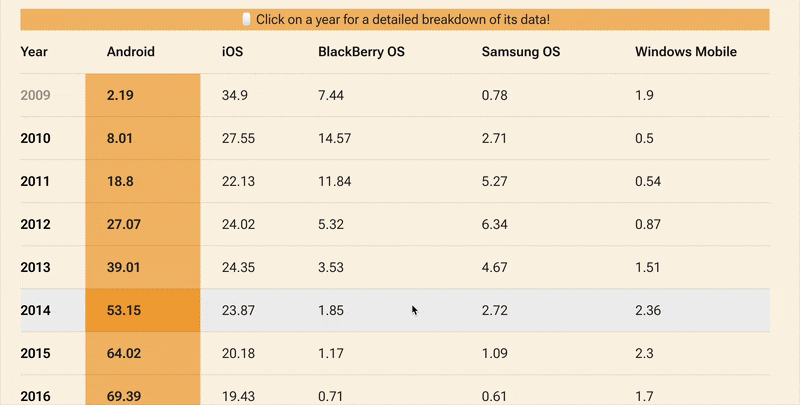
Highest Worldwide iOS Market Share
34.9% (2009)
Highest Worldwide BlackBerry Market Share
14.57% (2010)
Highest Worldwide Samsung OS Market Share
6.34% (2012)
Highest Worldwide Windows Mobile Market Share
12.26% (2014)
Data Modifications
Data has been averaged from market share per month to average market share in a year for clarity and simplicity.
Original Source
Statcounter.com